Creating Your First Compute Instance
Problem: How do I provision a new server with the right specifications for my application? Why it matters: Choosing the correct configuration upfront prevents performance issues and unnecessary costs later. Navigate to the Computes tab and click New Compute to begin. You’ll configure your instance through six steps:Choose Location
Select a hosting location for your server.The location you choose affects network latency and performance for your users. Select a location closest to where your primary traffic originates.
Choose Image
Select an operating system image for your compute.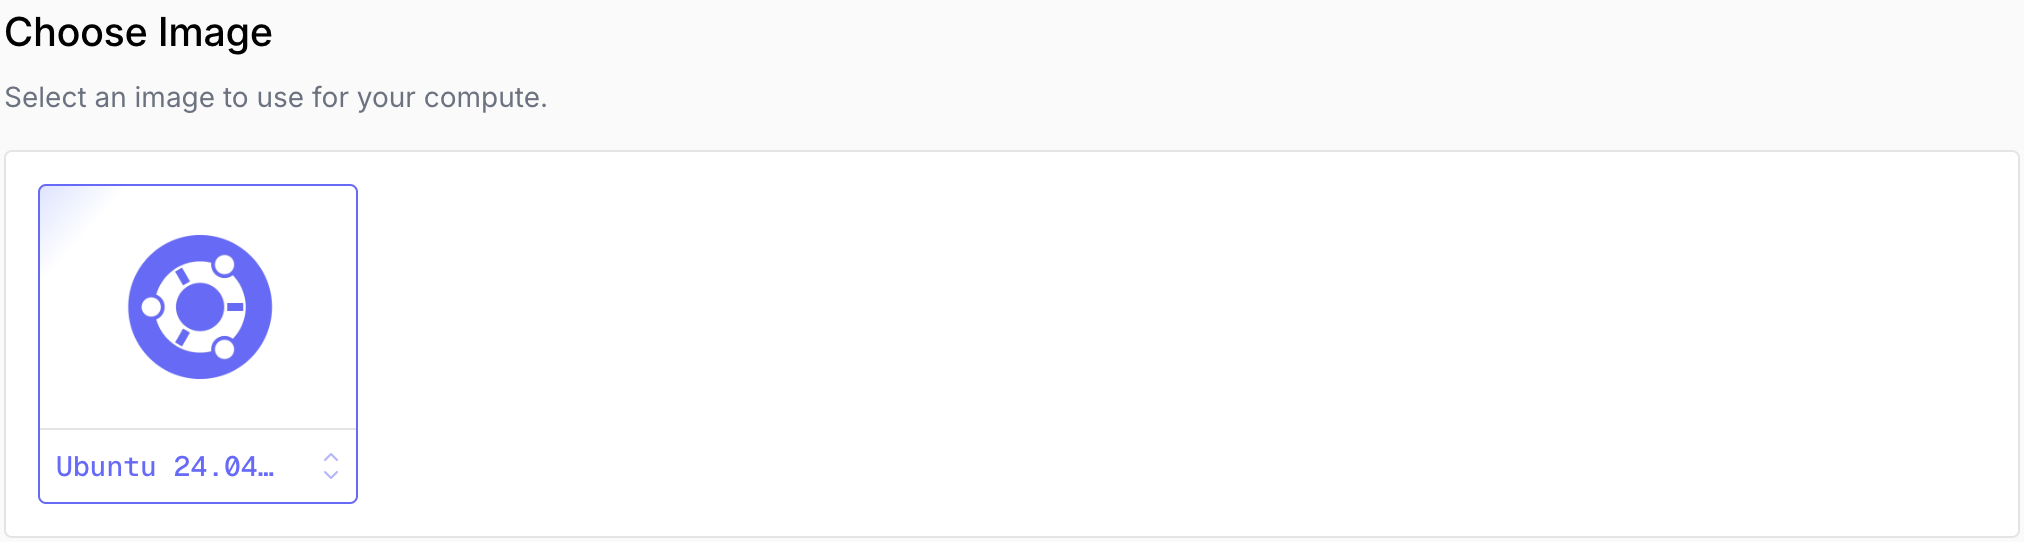
Choose Type and Specifications
Select your compute configuration: 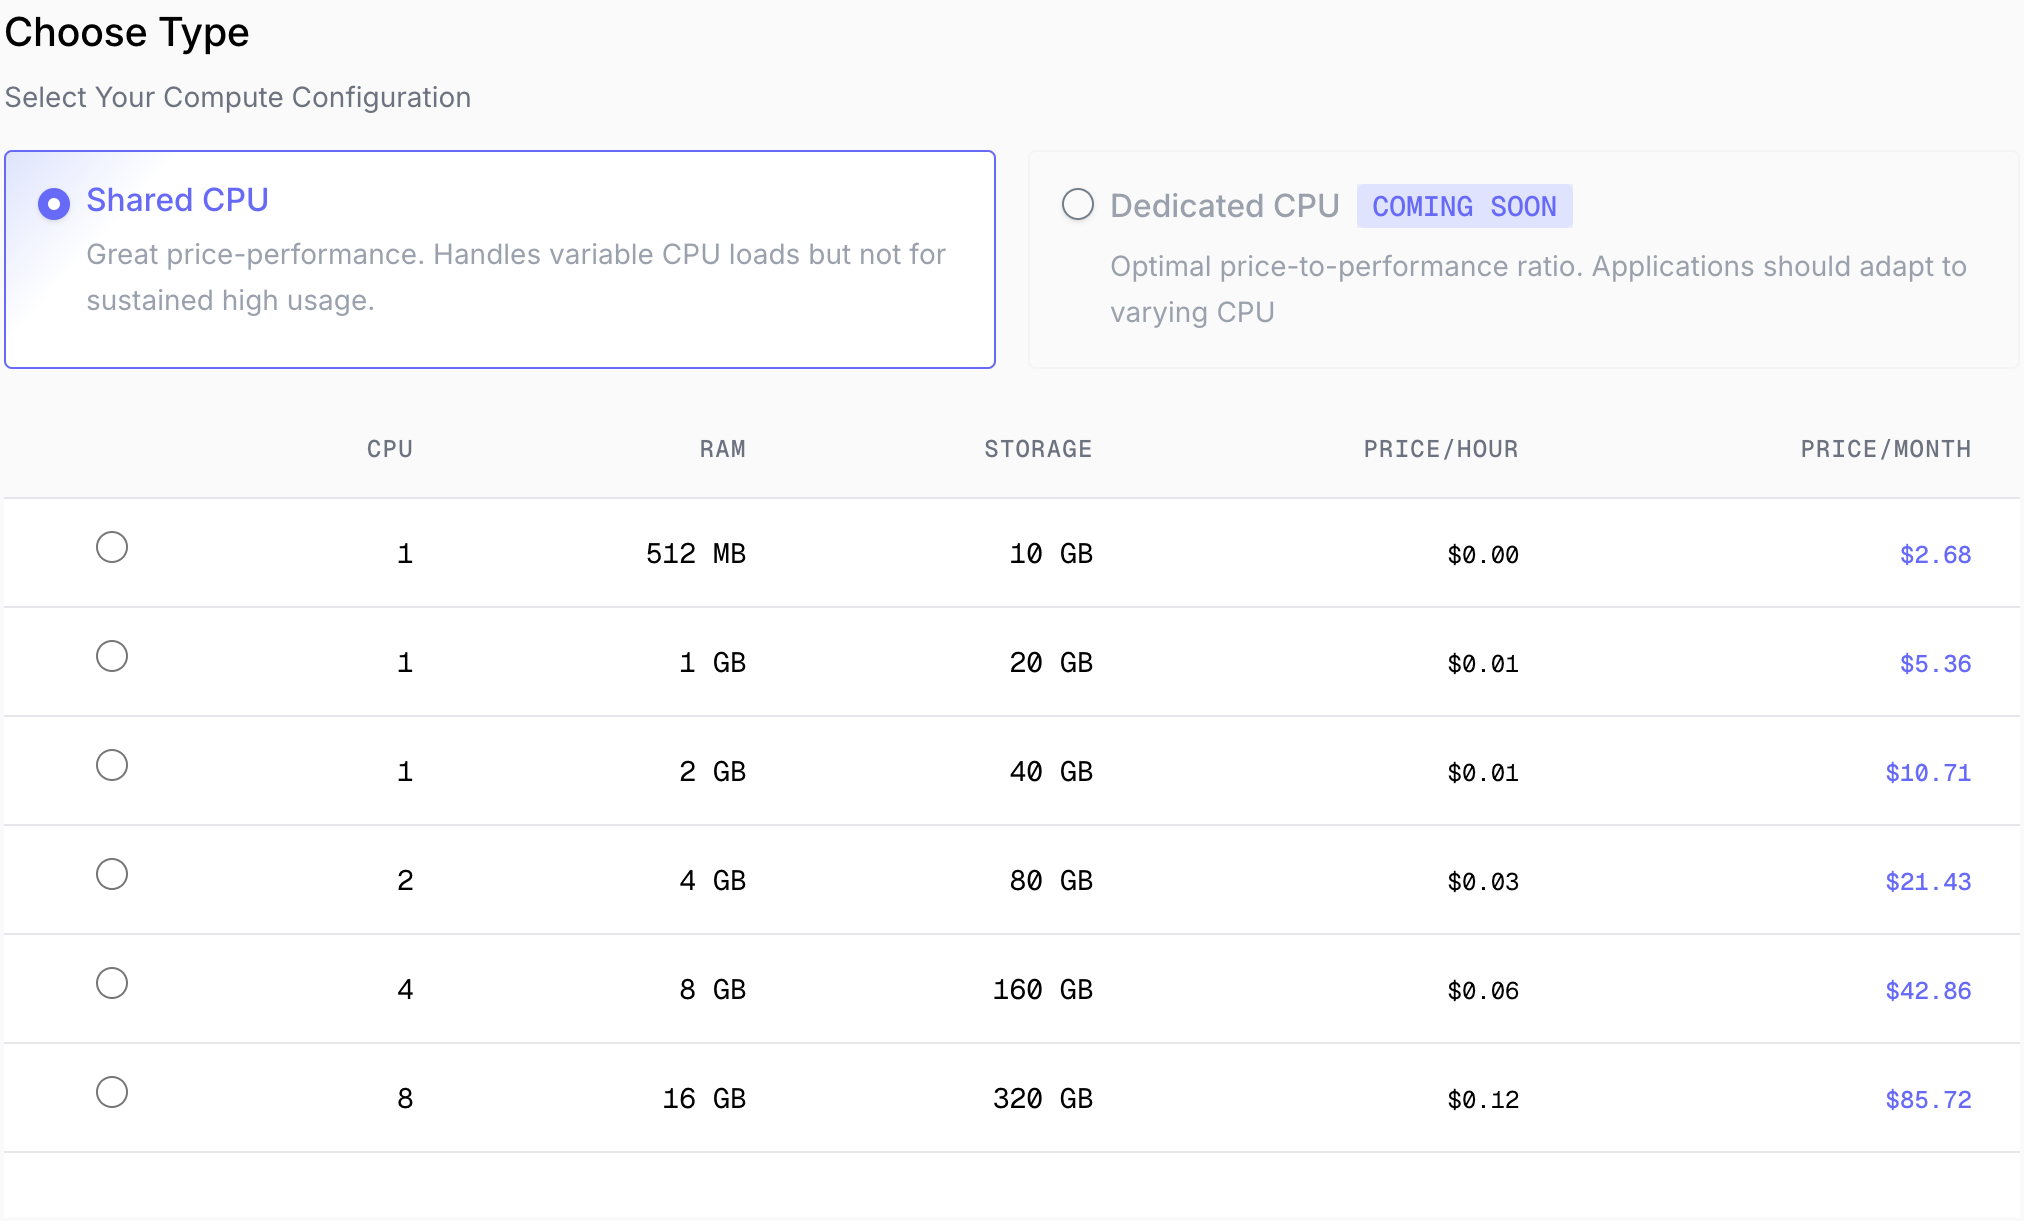
shared or dedicated CPU.Configure Authentication
Choose how you will securely access your compute instance:
- SSH Keys (Recommended): Select an existing SSH key attached to your team for automatic, passwordless access. See our SSH Keys guide for setup instructions.
- Password: Create a secure password for root user access.
Configure Name and Tags
Compute Name: Give your compute an identifiable name that describes its purpose (e.g., “api-production”, “staging-web-server”)Add Tags (Optional): Organize and manage your computes with custom tags. Useful for filtering, cost allocation, or automation.
Review and Create
Review your configuration and pricing, then click Create Compute.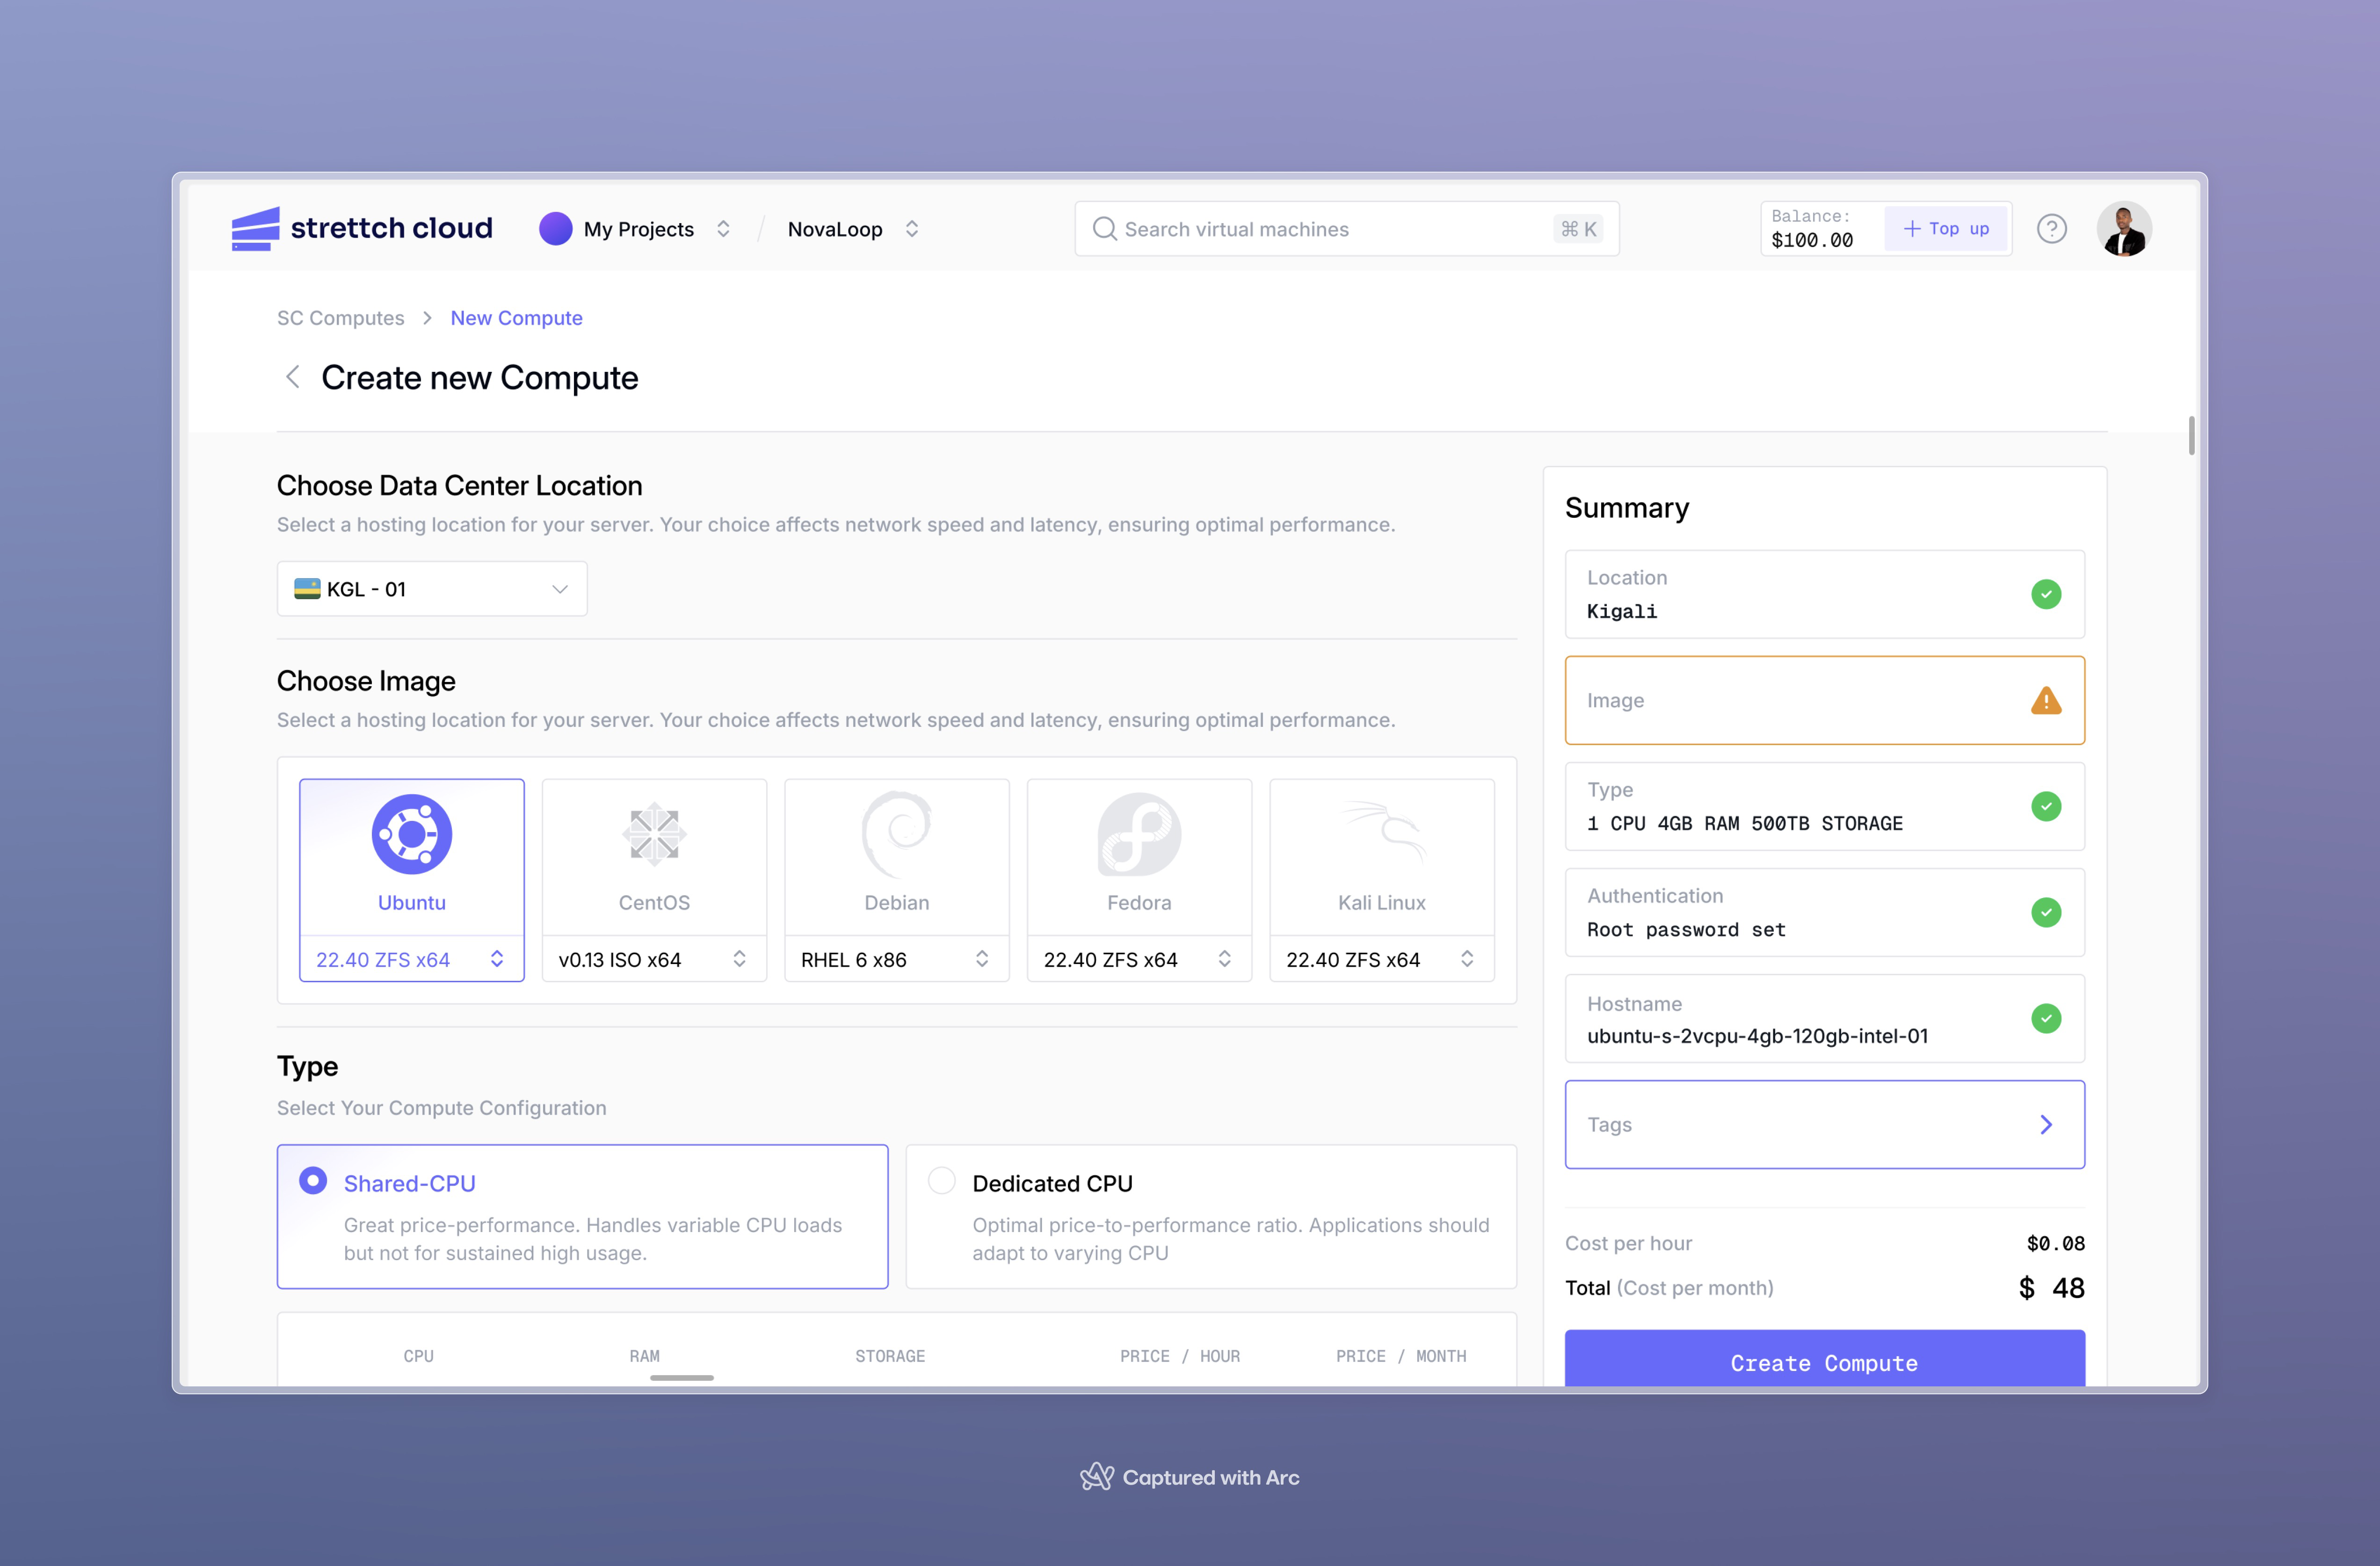
Your compute cost depends on the specs you selected. The price is shown during configuration. Ensure you have sufficient credits in your account to create the compute.
Connecting to Your Compute Instance
Problem: How do I access my compute instance to install applications and manage services?Using the Web Console
Access your compute through a browser-based console without needing any SSH client software.Navigate to Console
Click your compute name from the dashboard, then click Console in the left menu.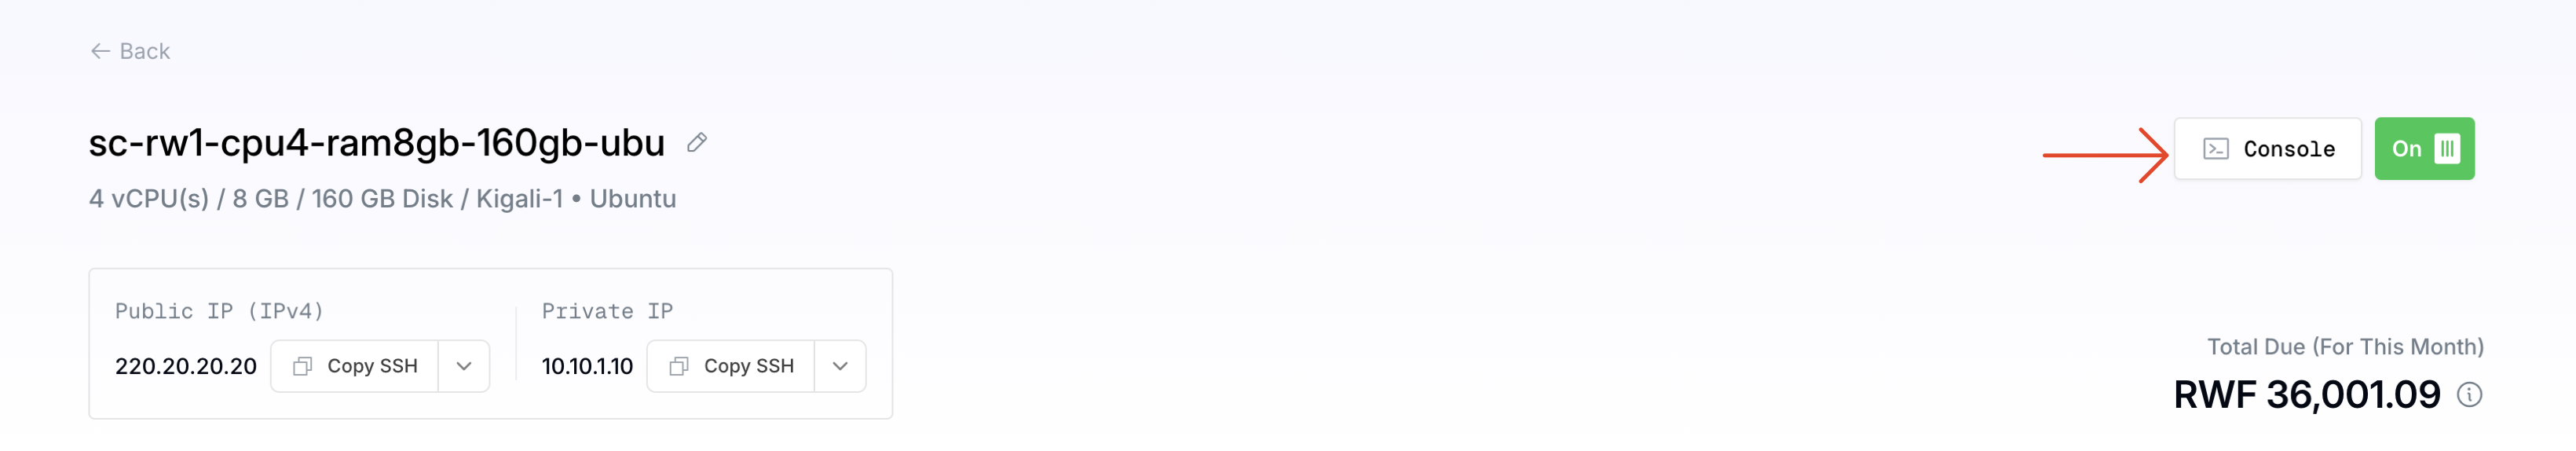
Wait for SC Agent Installation
The SC Agent is automatically installed on your compute. It will be ready within a few minutes of compute creation.The SC Agent enables browser-based console access. You can start using the console as soon as the agent installation completes.
Using SSH Access
Connect directly via SSH from your local terminal for a native command-line experience.Find Your Compute IP Address
Locate your compute’s public IP address on the compute details page in the dashboard.
Connect via SSH
Open your terminal and connect using this command:Replace
SSH connection
your-public-ip with your actual compute IP address.Example:Example
Port 222: Strettch Cloud uses port 222 instead of the default port 22 for SSH access due to a firewall restriction from our upstream internet provider. This applies to most connections. However, if you are connecting from within certain networks (such as MTN in Rwanda), you may be able to connect using the default port 22 without specifying
-p 222.Understanding Networking
Problem: How do I make my compute instance accessible from the internet, and when should I use public vs private networking? Why it matters: Proper network architecture significantly improves security by limiting attack surface and helps reduce costs by only paying for public IPs where needed.Public IP Addresses (Optional)
By default, compute instances are not assigned a public IP address. They remain in a private network, inaccessible from the internet but able to communicate with other instances in your team.When You Need a Public IP
You need a public IP address when your instance must:- Receive incoming connections from the internet (web servers, APIs, public-facing services)
- Be accessed via SSH directly from your local machine
- Serve as an entry point to your infrastructure (reverse proxies, load balancers)
Cost
How to Attach a Public IP
When creating a compute instance, you’ll see an option to attach a public IP: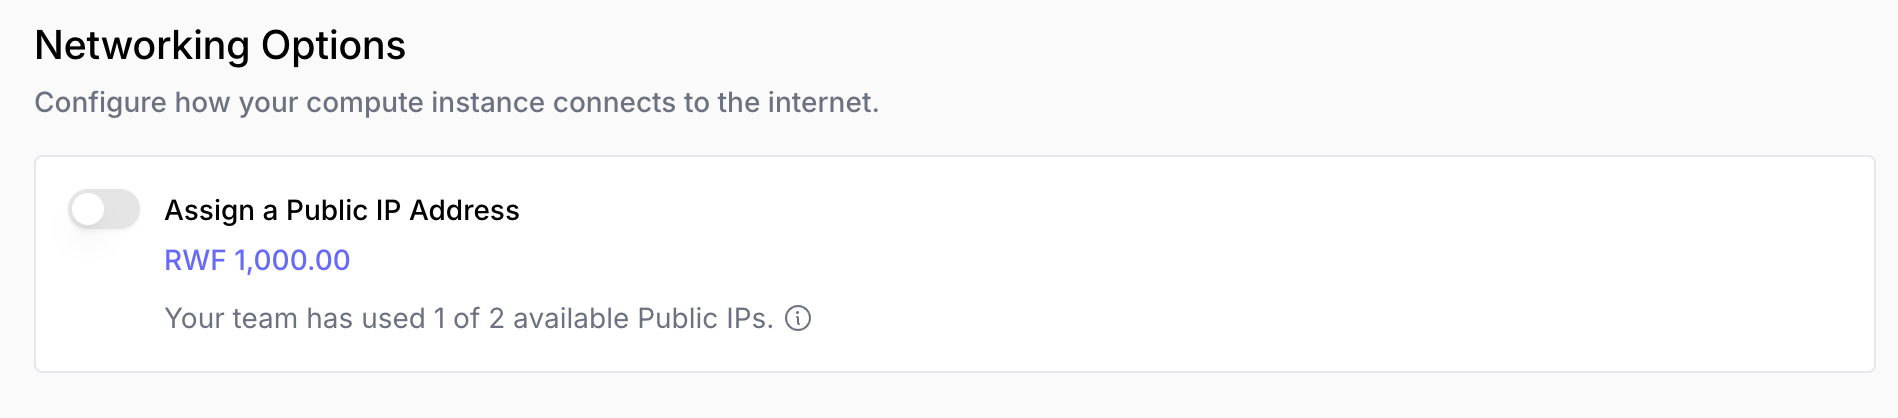
Private Network Architecture (Recommended for Security)
Problem: How can I improve security while running multiple services? Best practice: Use a single public-facing instance as a gateway, keeping your application servers private.Example Architecture
Imagine you’re running a web application with these components: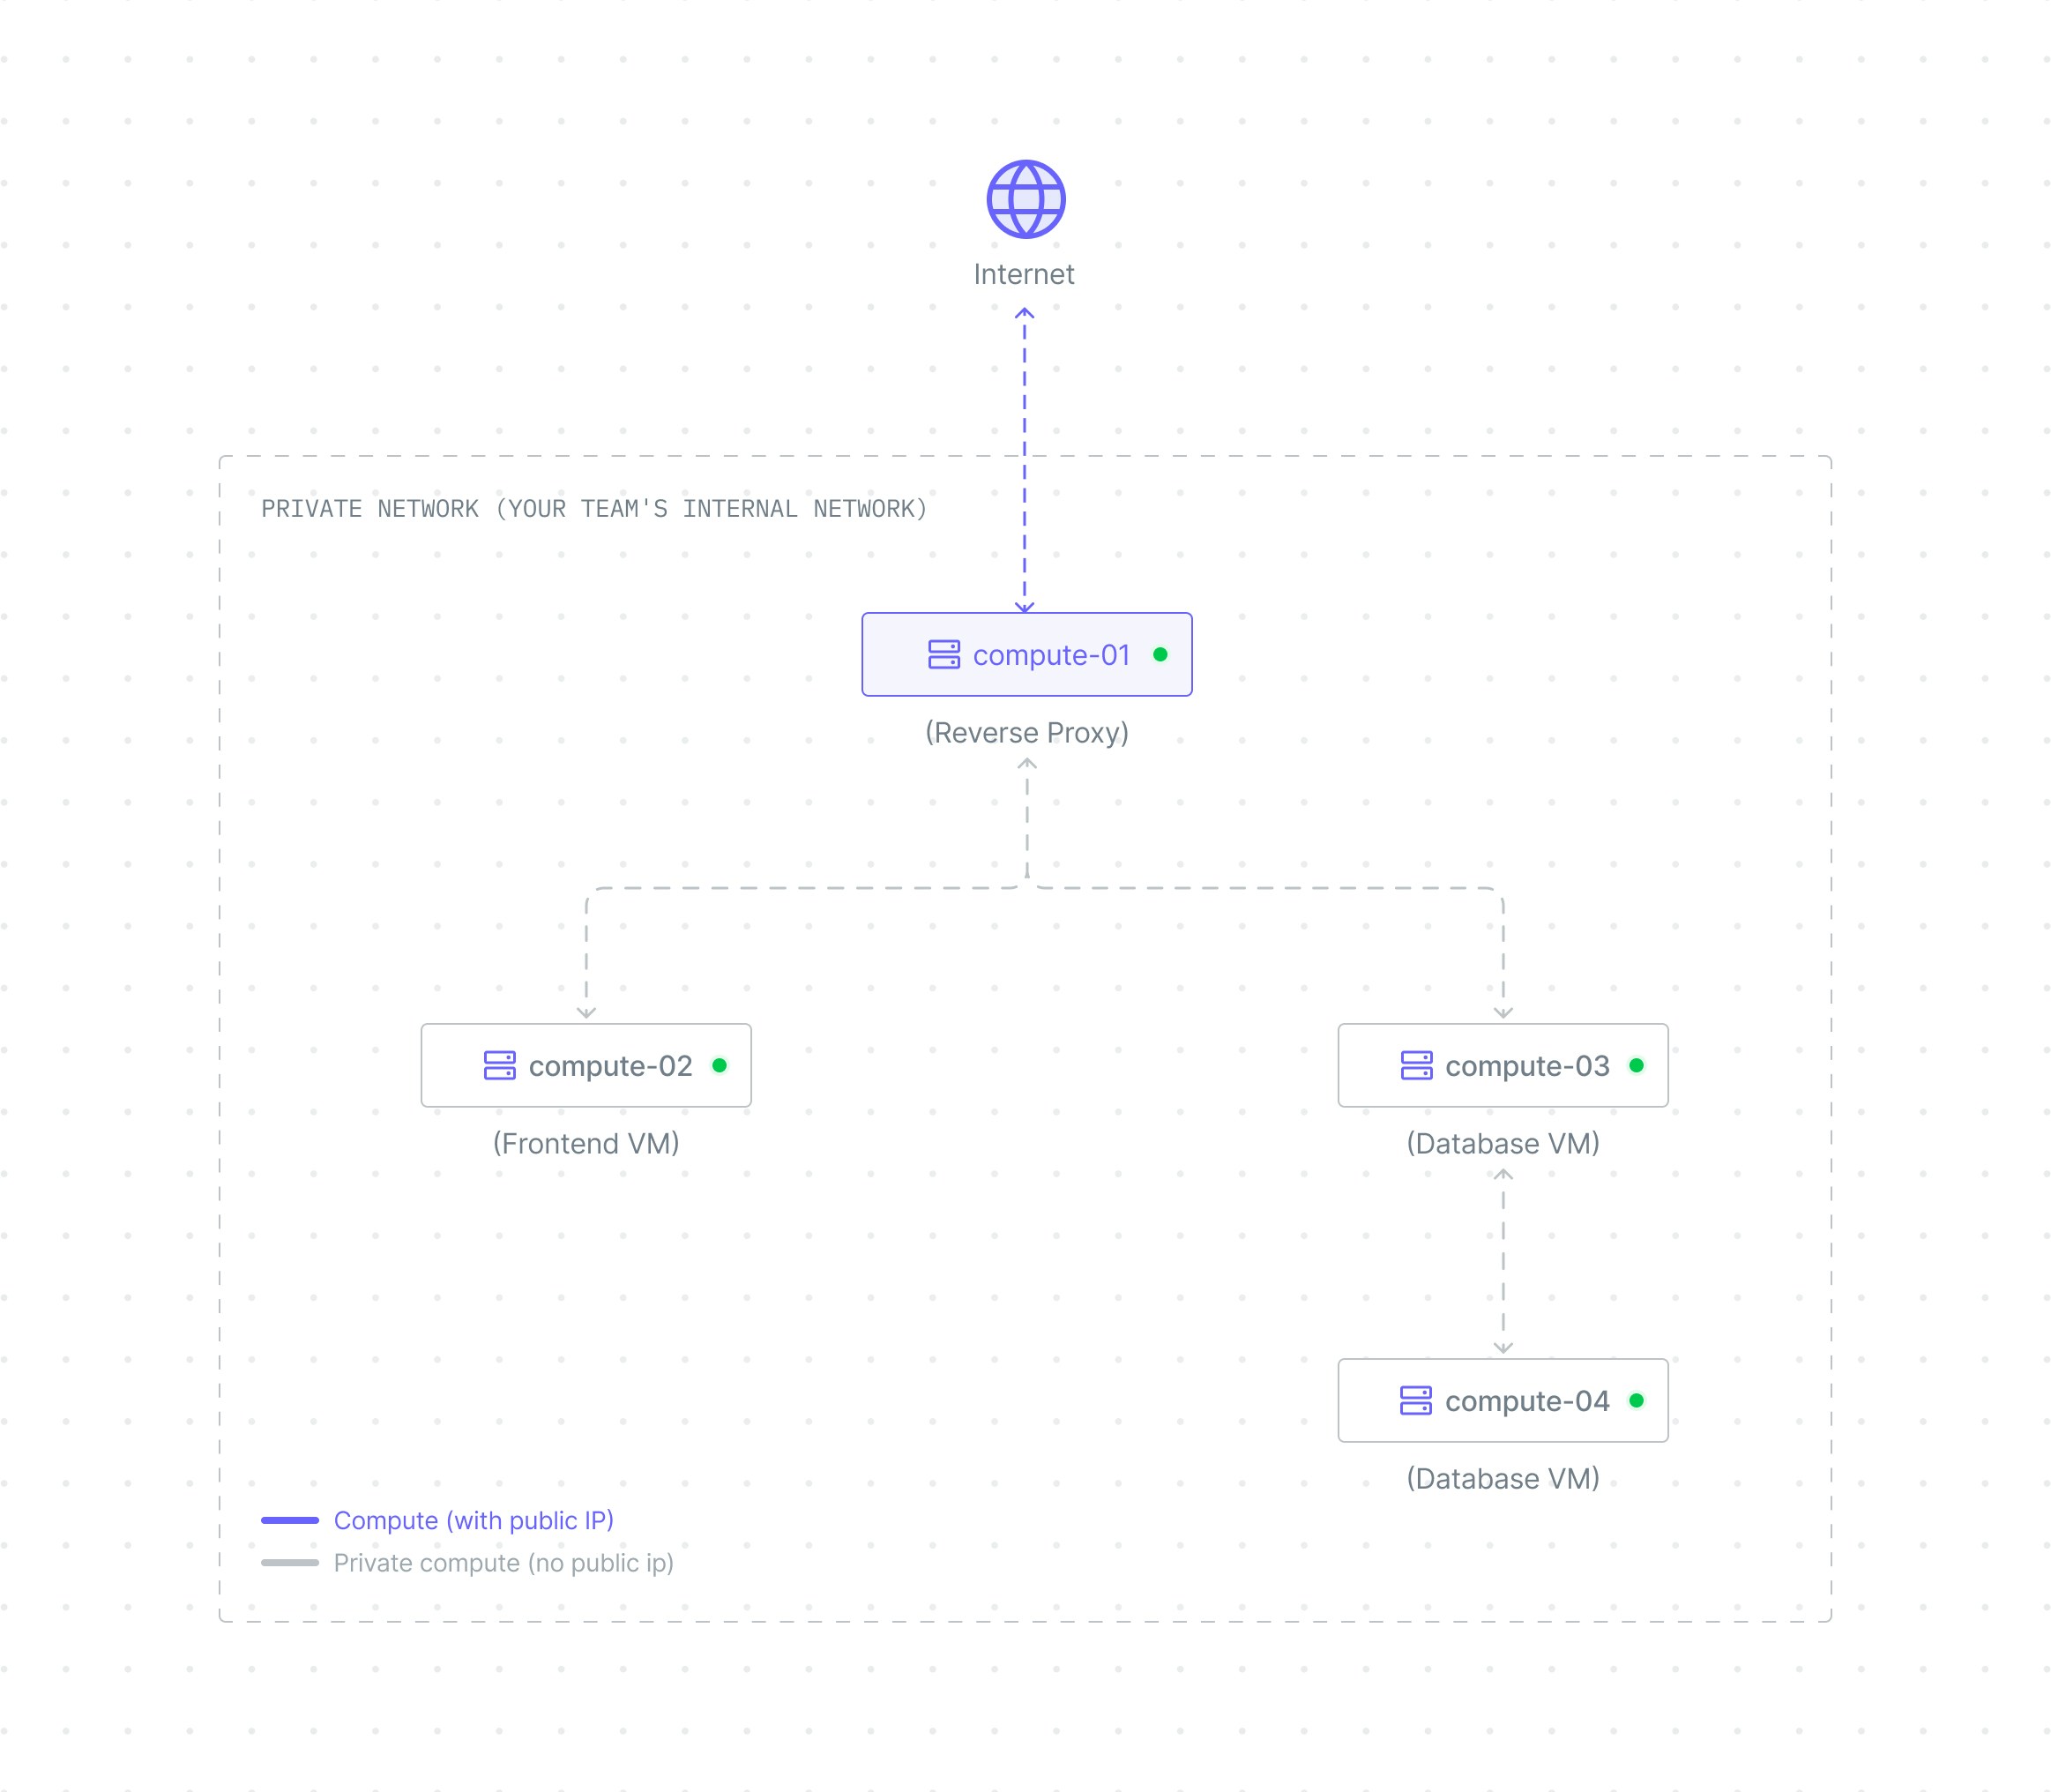
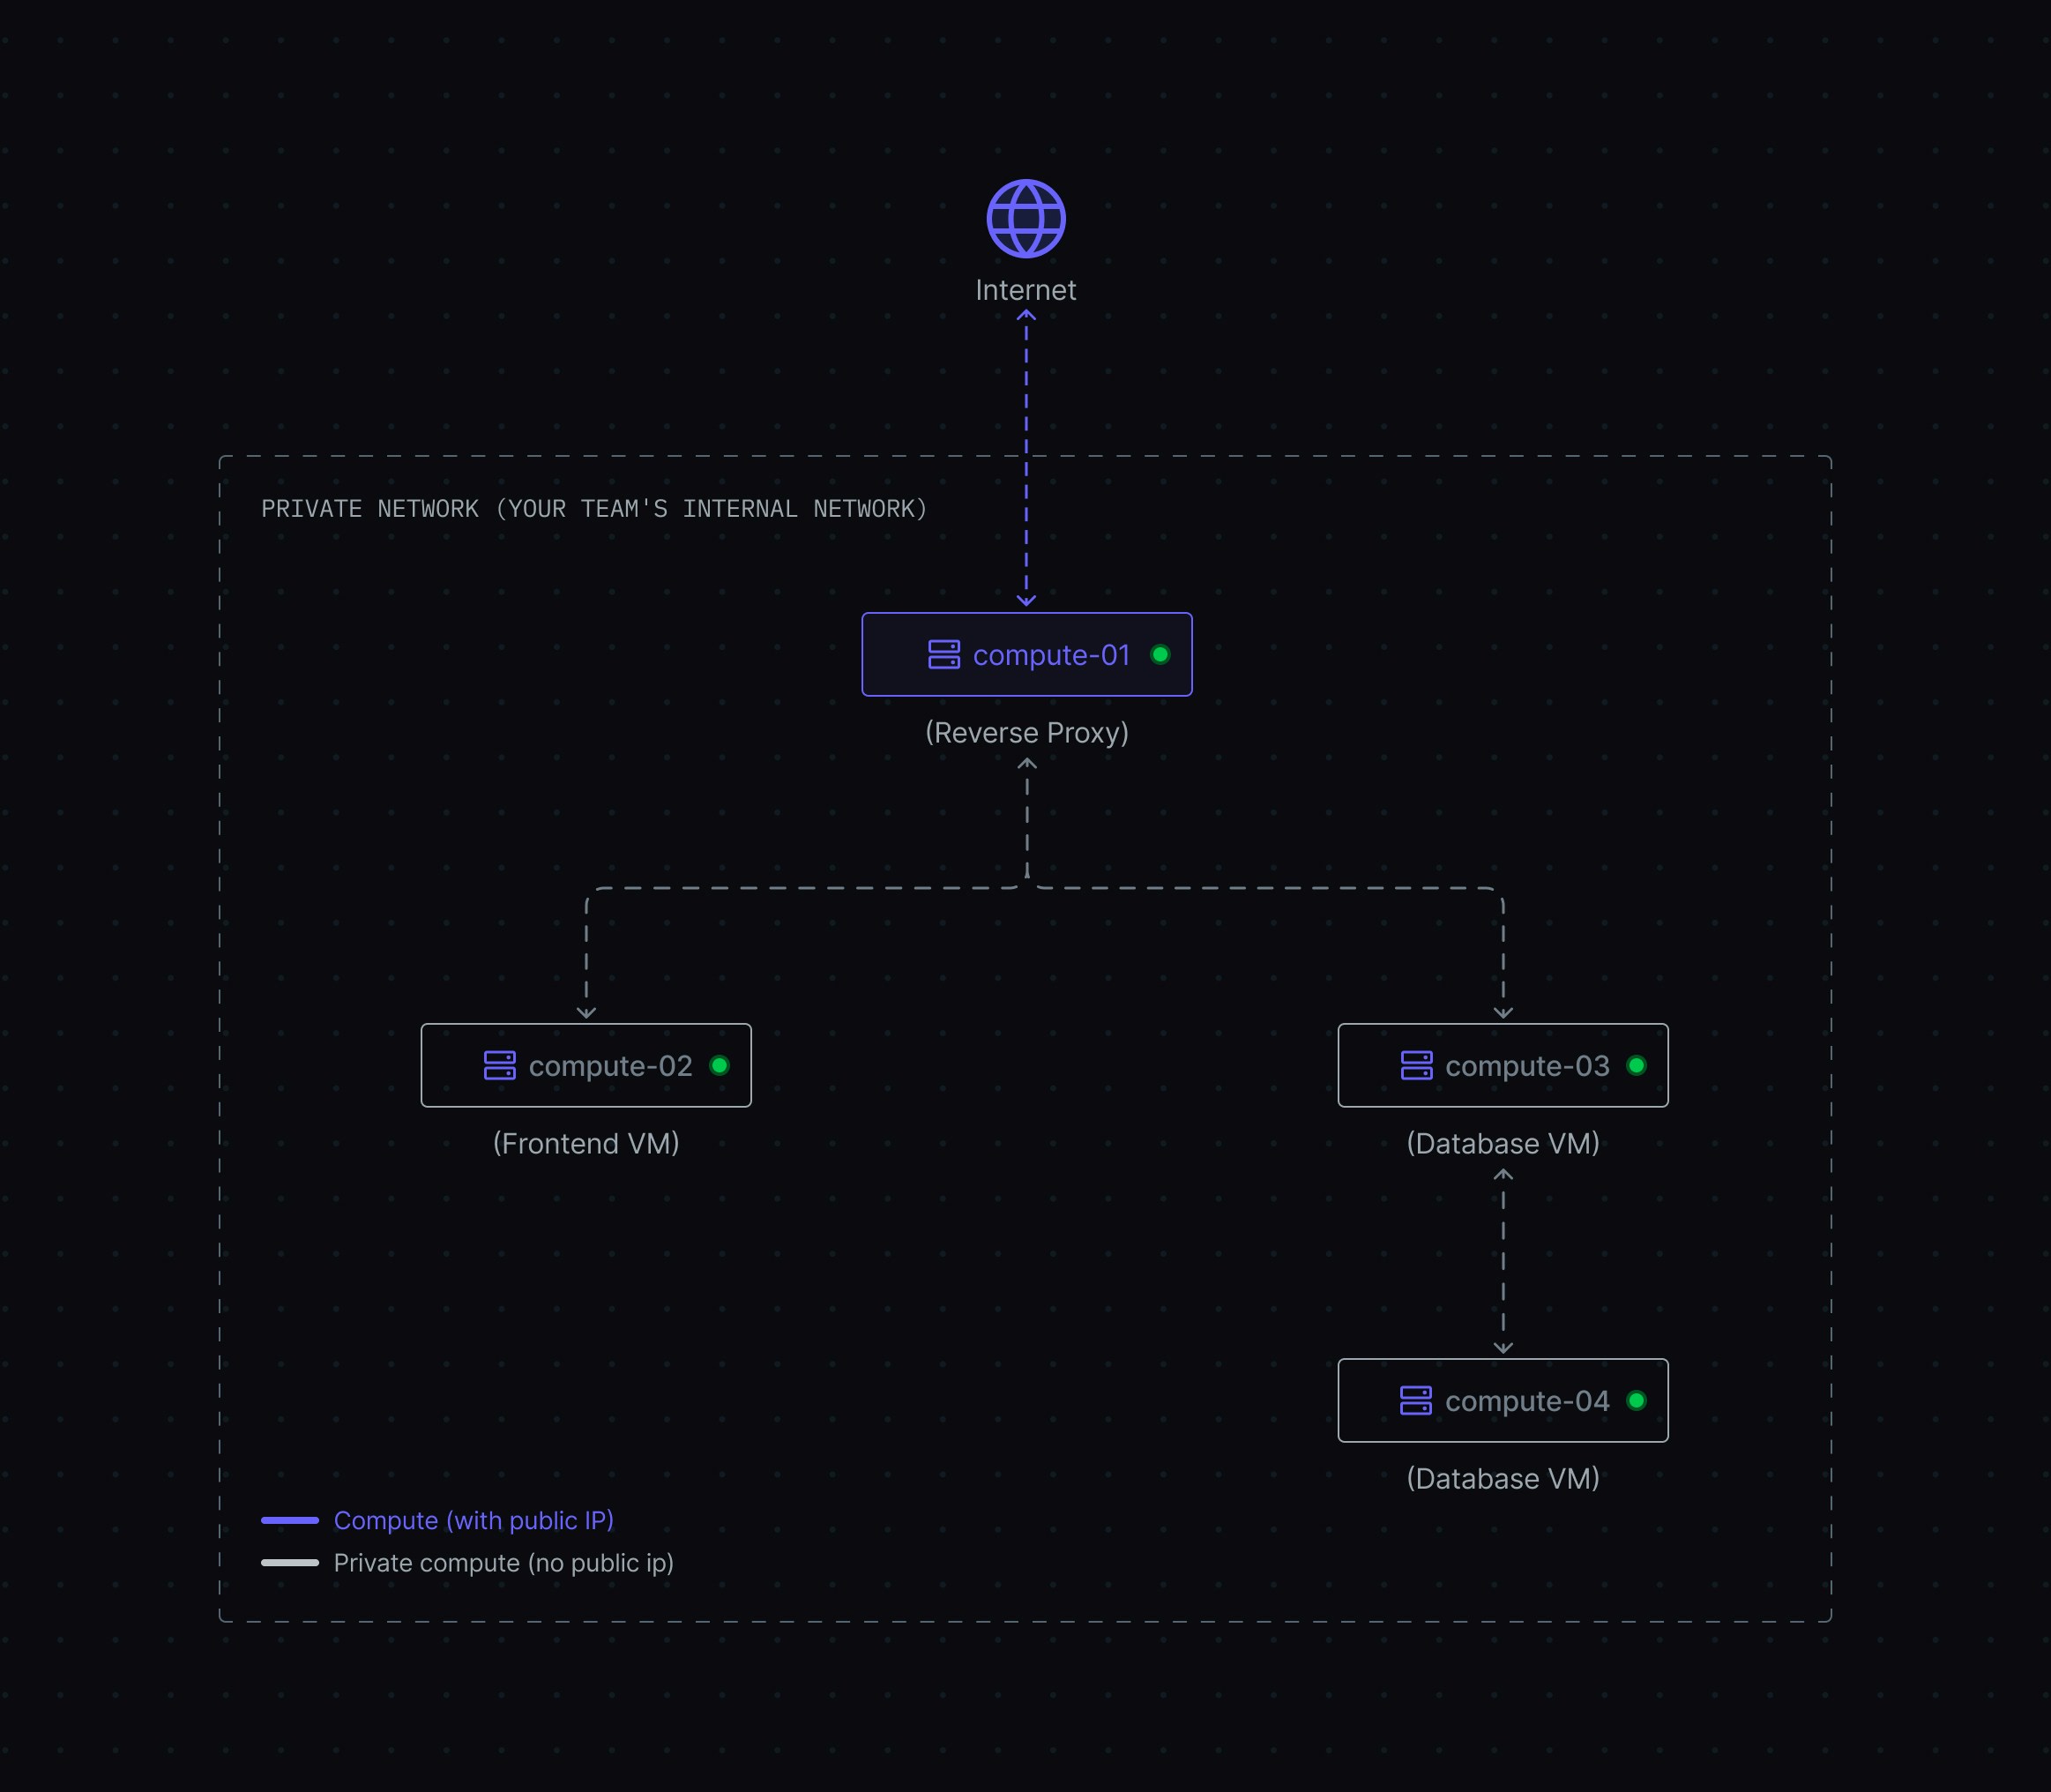
- All computes exist in a secure private network where they can communicate with each other
- Reverse Proxy: Has a public IP attached, making it accessible from the internet and able to route traffic to private services
- Frontend, Backend, Database: No public IPs attached, so they remain inaccessible from the internet but can communicate within the private network
- Enhanced Security - Only one compute is exposed to the internet, reducing attack surface
- Cost Savings - Pay for only one public IP instead of multiple (public IPs are billed separately)
- Centralized Public Security - Configure internet-facing firewalls, SSL certificates, and security rules in one place
- Simplified Management - Update public security measures on one compute instead of multiple
Monitoring Performance and Health
Problem: How do I know if my compute instance is performing well or experiencing issues? Why it matters: Proactive monitoring helps you identify performance bottlenecks, plan capacity upgrades, and troubleshoot issues before they impact users. Click on your compute name in the Computes tab to access detailed monitoring and management.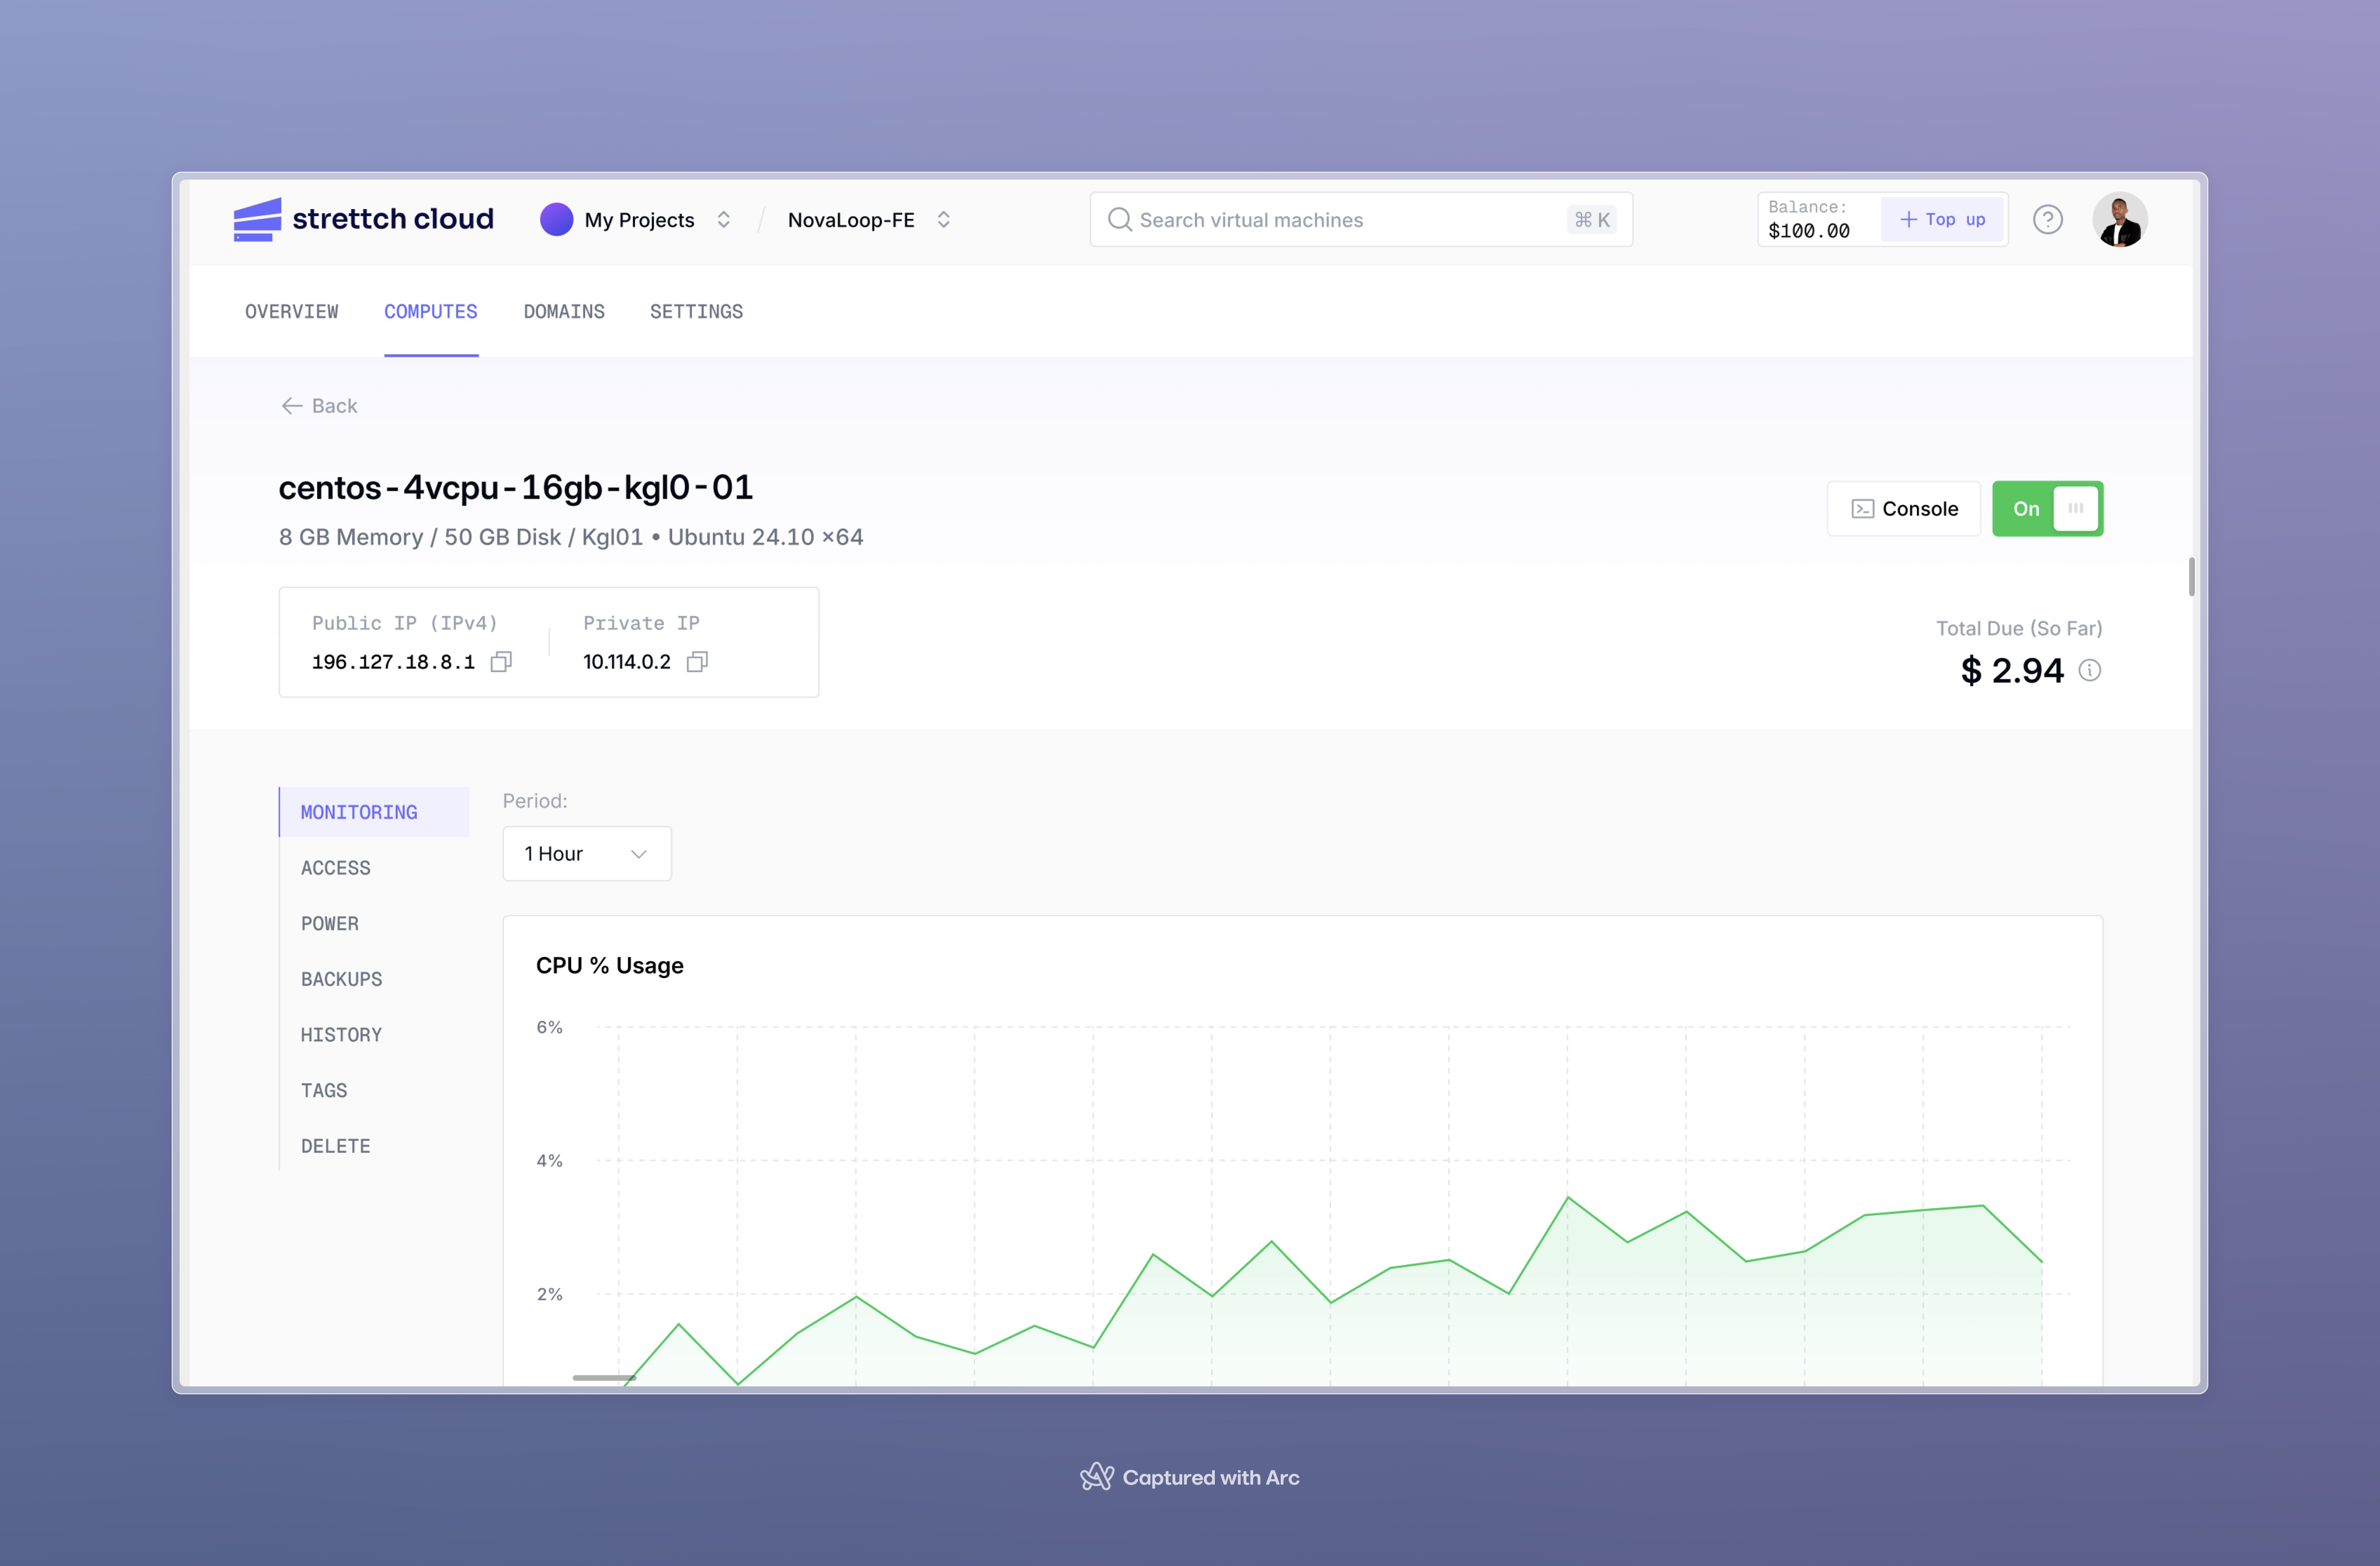
Available Metrics
Your compute includes five real-time performance graphs that help you understand resource utilization:| Metric | What It Shows | What to Watch For |
|---|---|---|
| Memory | Memory usage over time | Consistently high usage (>90%) indicates you need more RAM |
| CPU Usage | Processing power utilization (user jobs and system processes) | Sustained high CPU (>80%) suggests you need more CPU cores |
| Disk I/O | Read and write operations in MB/s | High I/O wait times can slow down applications |
| Network | Inbound and outbound traffic (packets) | Unexpected spikes may indicate traffic anomalies |
| Load | System load average (number of processes waiting for CPU) | Load higher than CPU count suggests resource contention |
Time Range Options
View graphs for different time periods to understand short-term issues or long-term trends:- 1 hour - Real-time troubleshooting
- 6 hours - Recent performance patterns
- 24 hours - Daily usage cycles
- 7 days - Weekly trends
- 30 days - Monthly patterns and capacity planning
SC Metrics Agent
The SC Metrics Agent automatically installs with your compute to collect performance data. This agent runs in the background and sends metrics to the dashboard for visualization.Managing Compute Power States
Problem: How do I control when my compute instance is running or stopped?Turning Your Compute ON or OFF
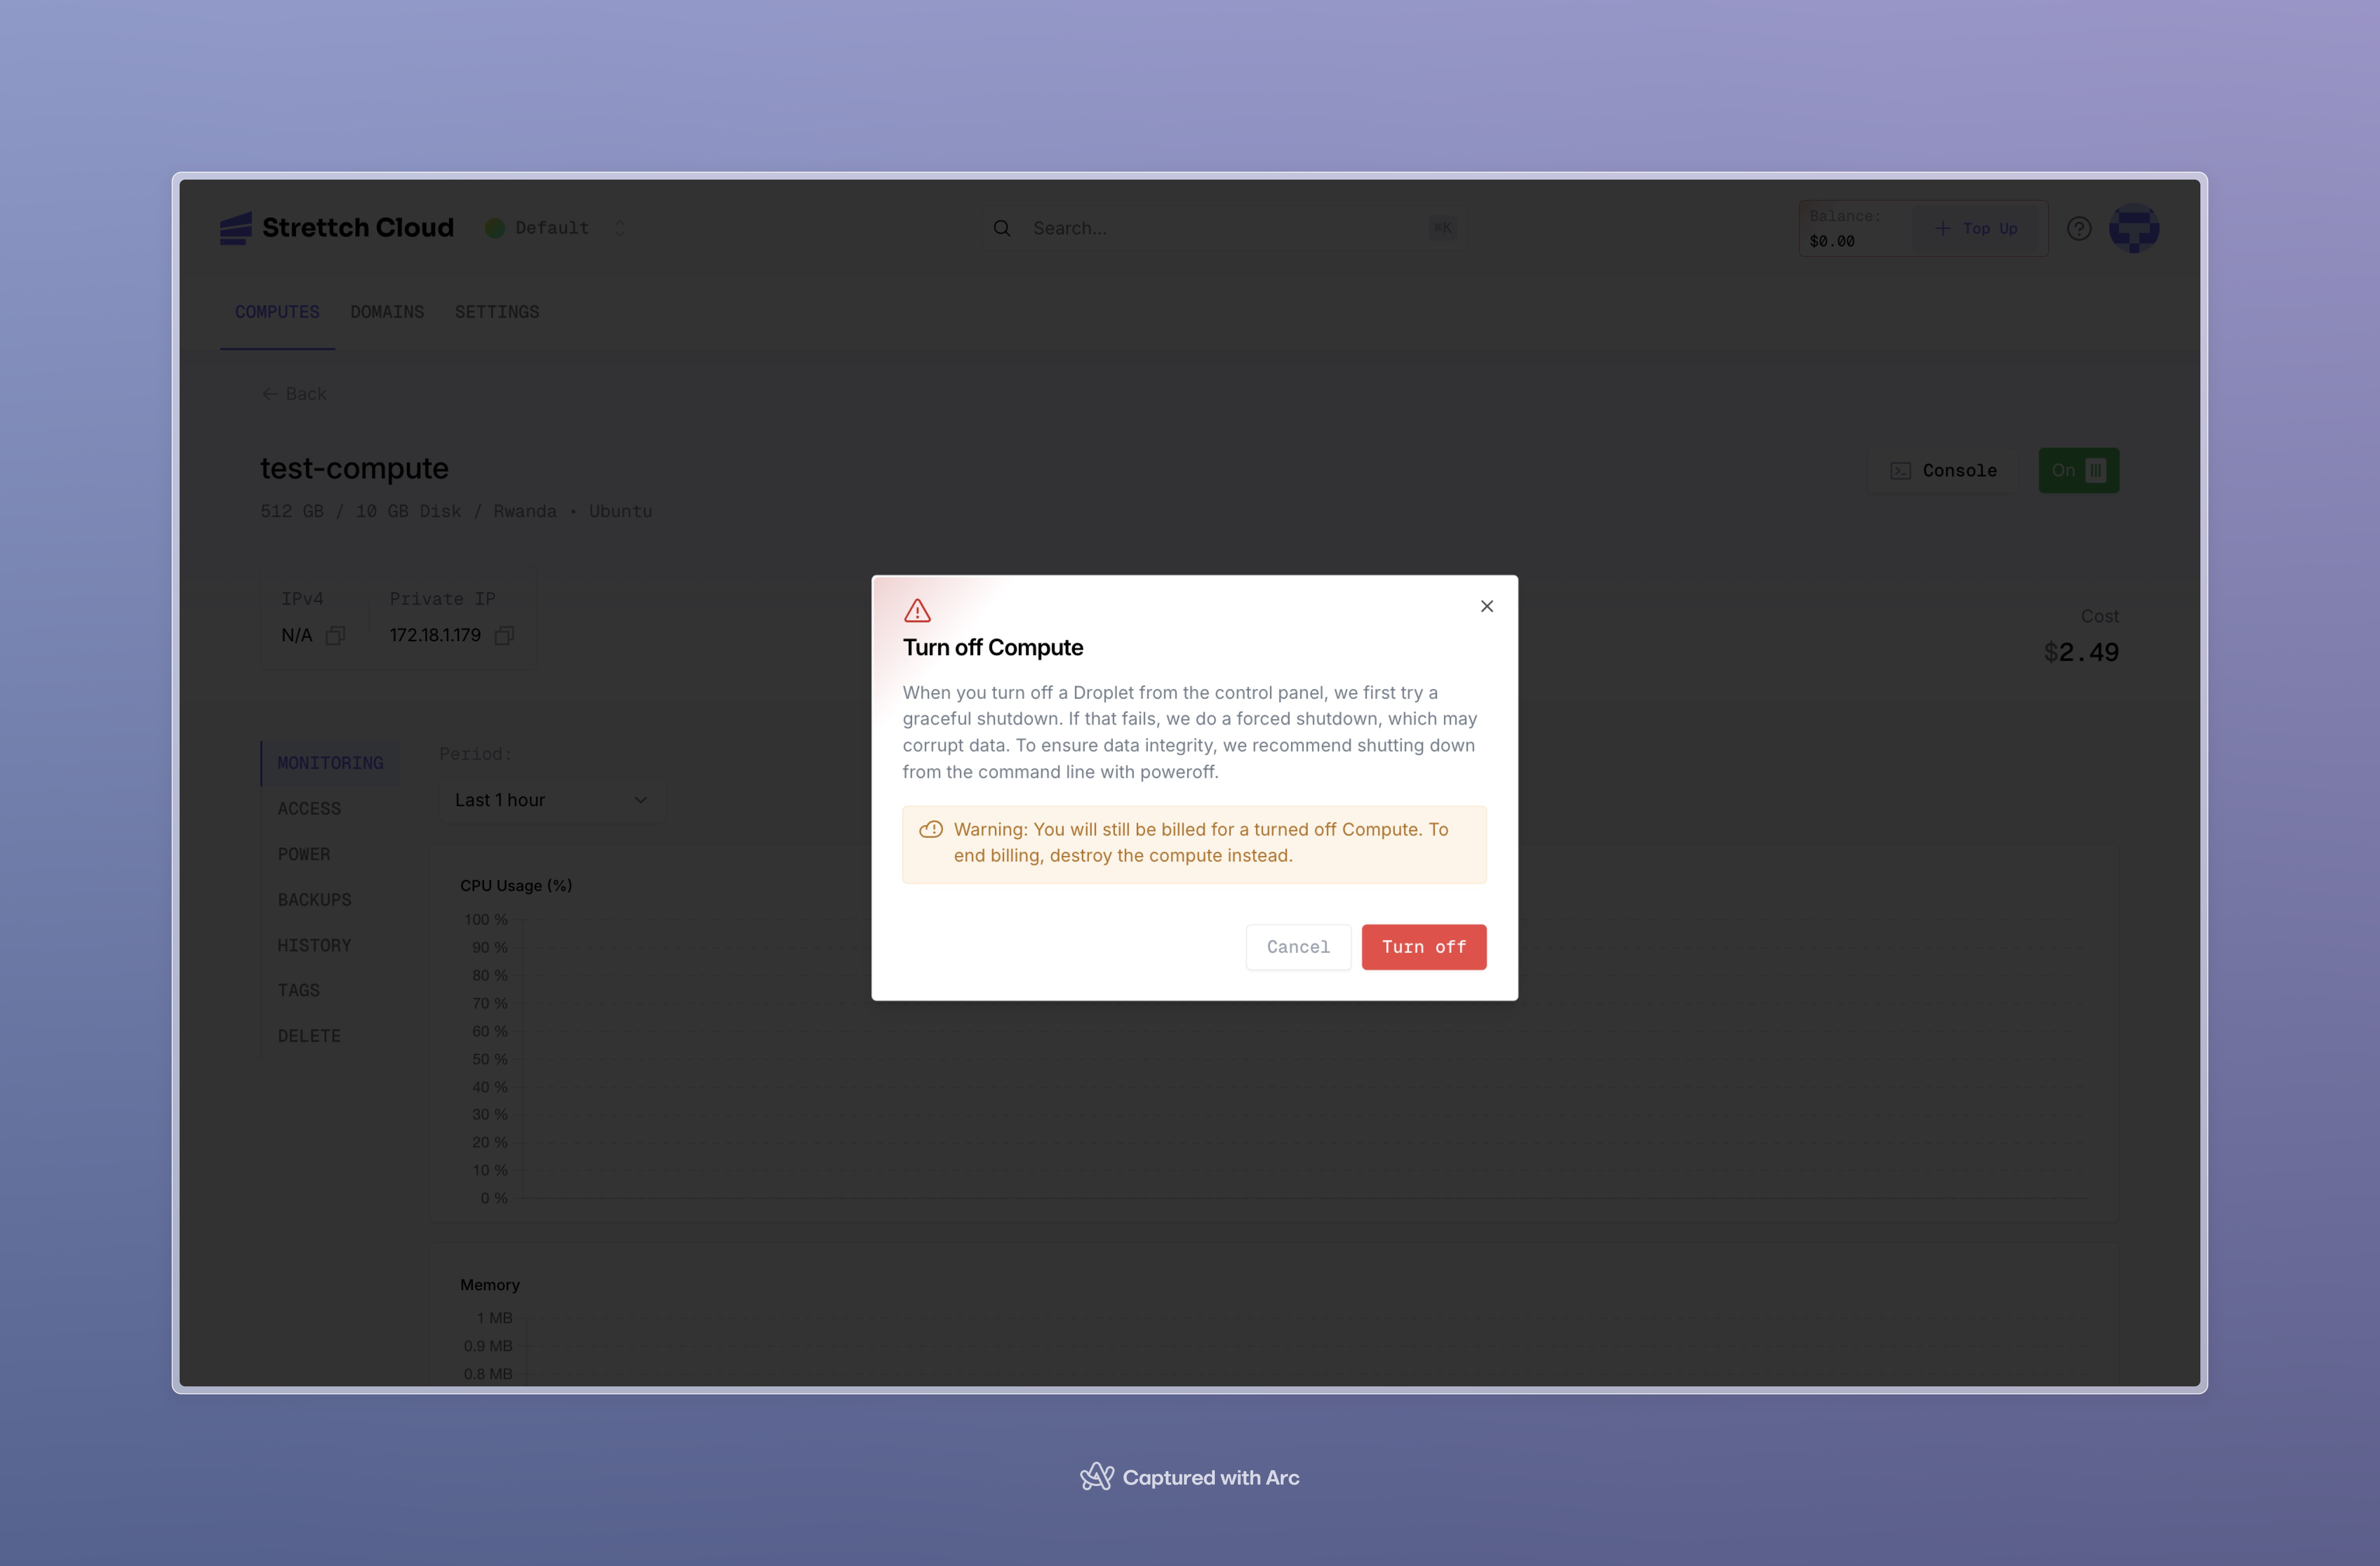
Graceful Shutdown from Command Line
For maximum data integrity, shut down from within your compute instance:Graceful shutdown
Best Practices
Problem: How do I ensure my compute instances are secure, performant, and cost-effective? Why it matters: Following best practices prevents security breaches, performance issues, and unexpected costs.Security
Use SSH Keys Instead of Passwords- SSH keys provide far stronger security against brute-force attacks than traditional passwords.
- Strettch Cloud allows you to natively inject your SSH keys into your instances during creation.
- Check out our SSH Keys documentation to learn how to add your public keys to your team dashboard for easy, secure deployments without ever manually editing an
authorized_keysfile.
- Regularly update your operating system and packages
- Run
apt update && apt upgrade(Ubuntu/Debian) or equivalent for your OS - Subscribe to security mailing lists for your distribution
- Use
ufw(Uncomplicated Firewall) oriptablesto restrict access - Only open ports that your applications actually need
- Consider using port 222 for SSH (as configured) to avoid automated scanners
- Create a non-root user for daily operations
- Use
sudofor administrative tasks - Only use root when absolutely necessary
Performance
Monitor Resource Usage- Check your monitoring graphs regularly
- Set up alerts for sustained high CPU or memory usage
- Plan upgrades before hitting resource limits
- Use shared CPU for development and staging
- Use dedicated CPU for production workloads
- Start small and scale up based on actual usage
- Profile your applications to find bottlenecks
- Use caching where appropriate (Redis, Memcached)
- Optimize database queries and indexes
Cost Management
Right-Size Your Instances- Don’t over-provision resources “just in case”
- Review metrics after a few weeks and adjust specifications
- Scale up only when metrics consistently show resource constraints
- Delete development or testing instances when not in use
- Remember: stopped instances still incur charges
- Use tags to identify instances that can be safely destroyed
- Monitor usage trends over 30 days
- Anticipate capacity needs before hitting limits
- Consider reserved instances for long-running workloads (if available)